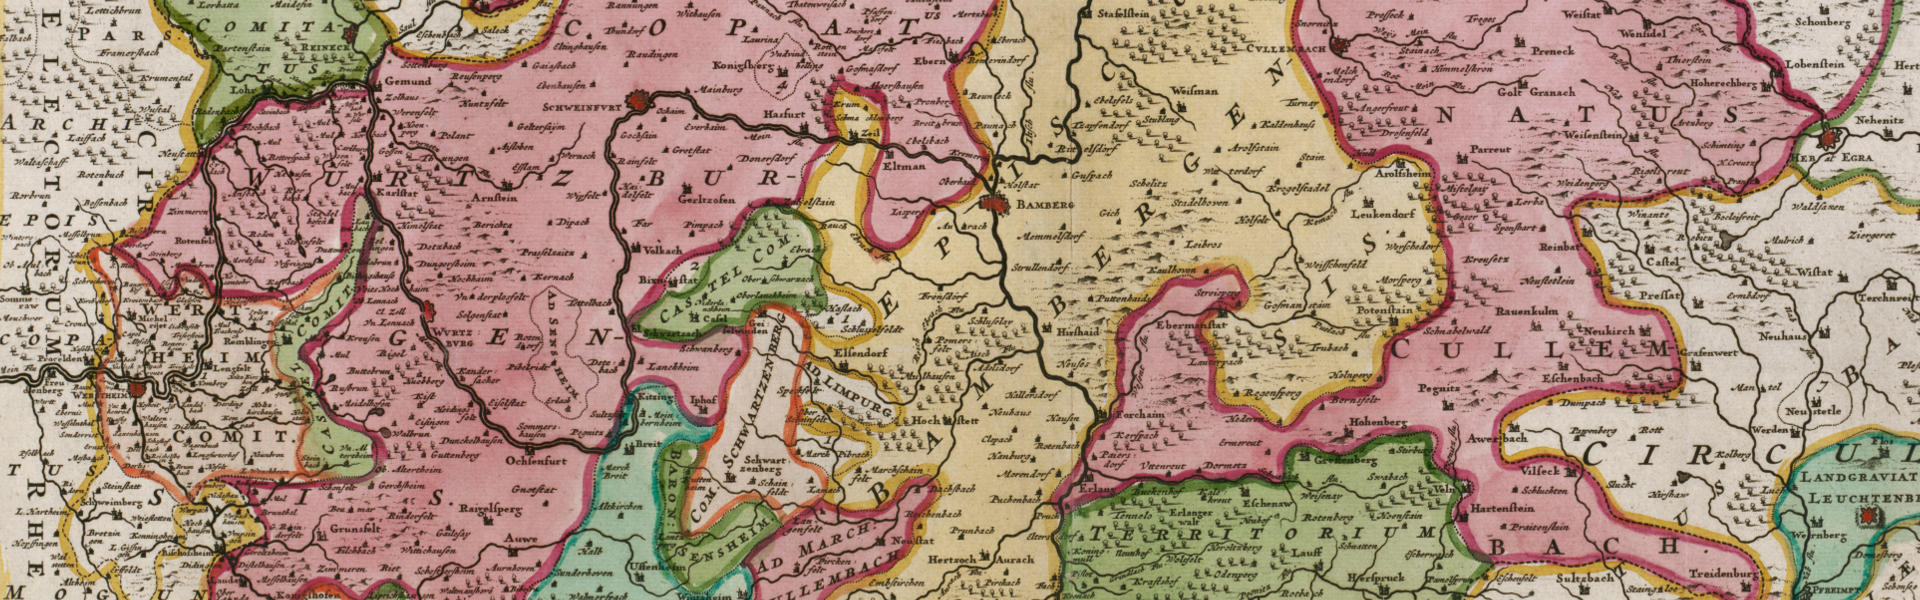
Extracting metadata from historical maps.
Manually collecting metadata from ancient maps is a tedious task. However, there is much interesting information in such maps. We do research on algorithms that allow computers to do the work.
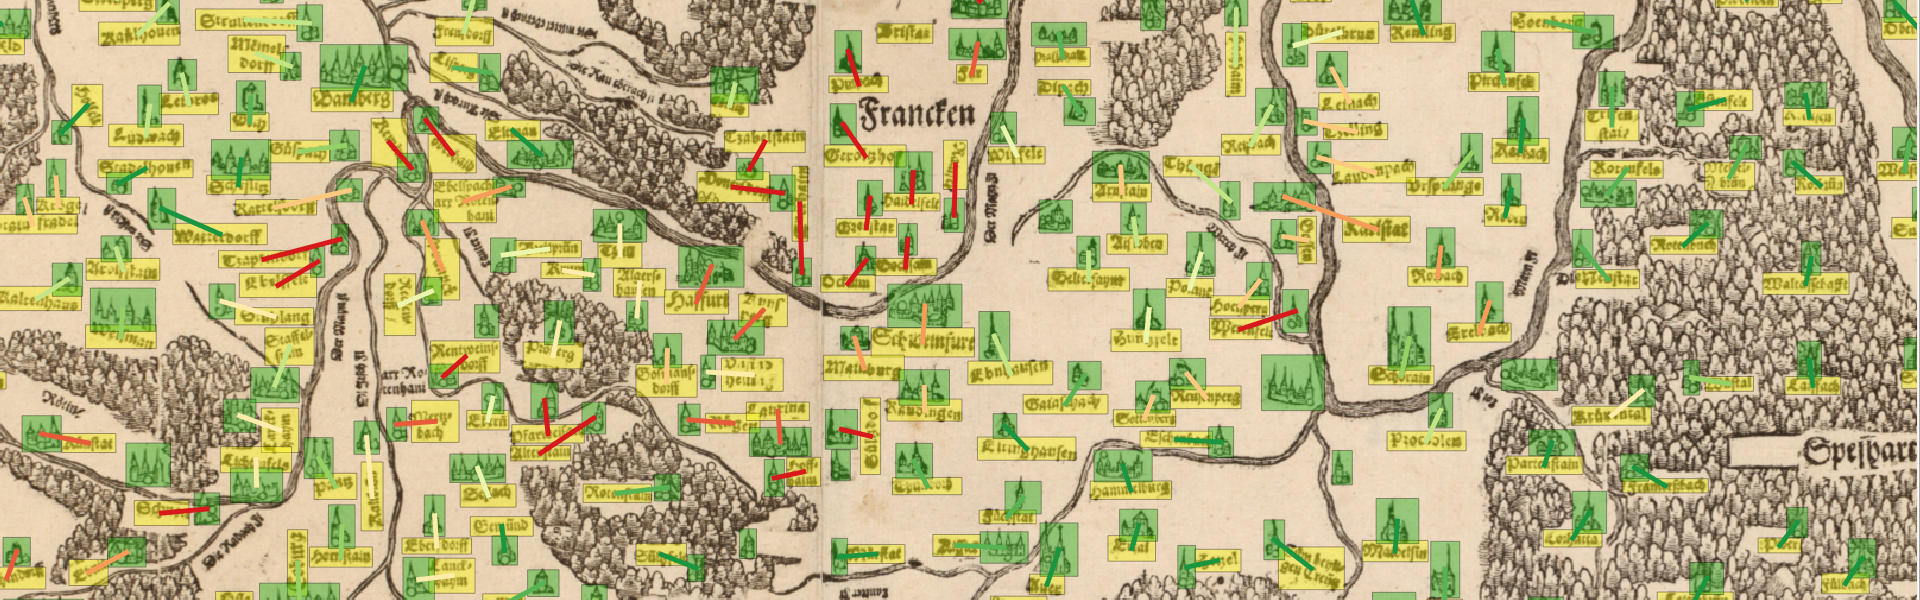
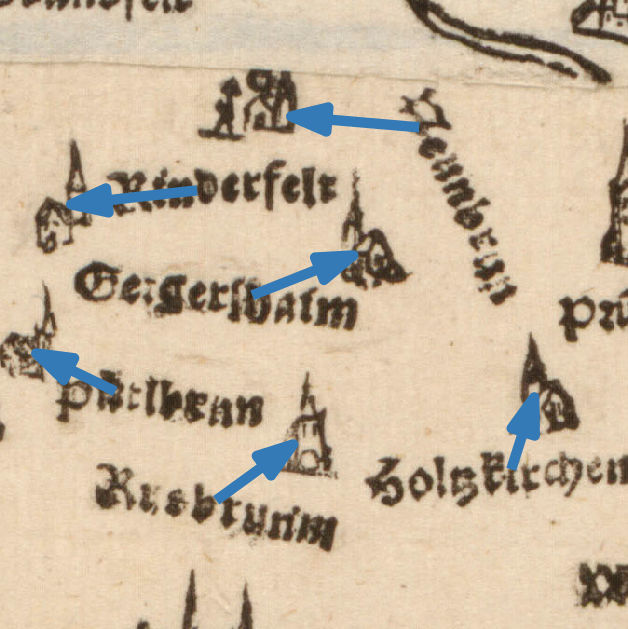
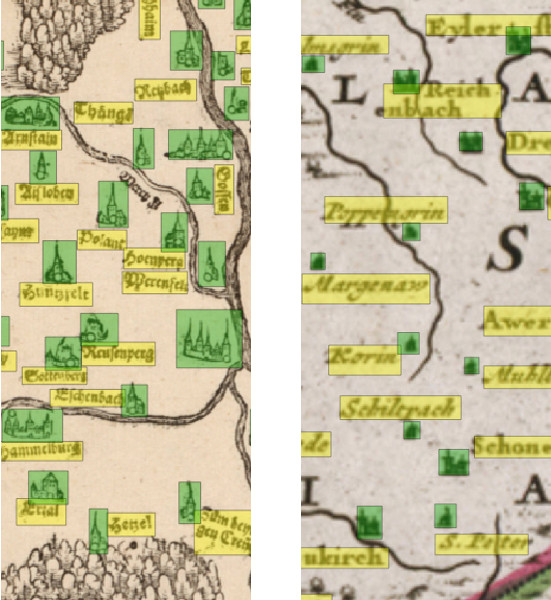
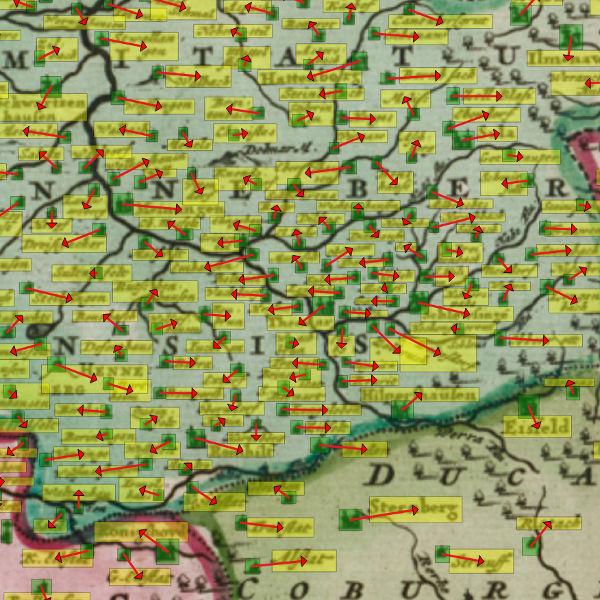
Assigning place markers and labels.
One important step in understanding the contents of historical maps is to be able to identify which label belongs to which place marker in the map.
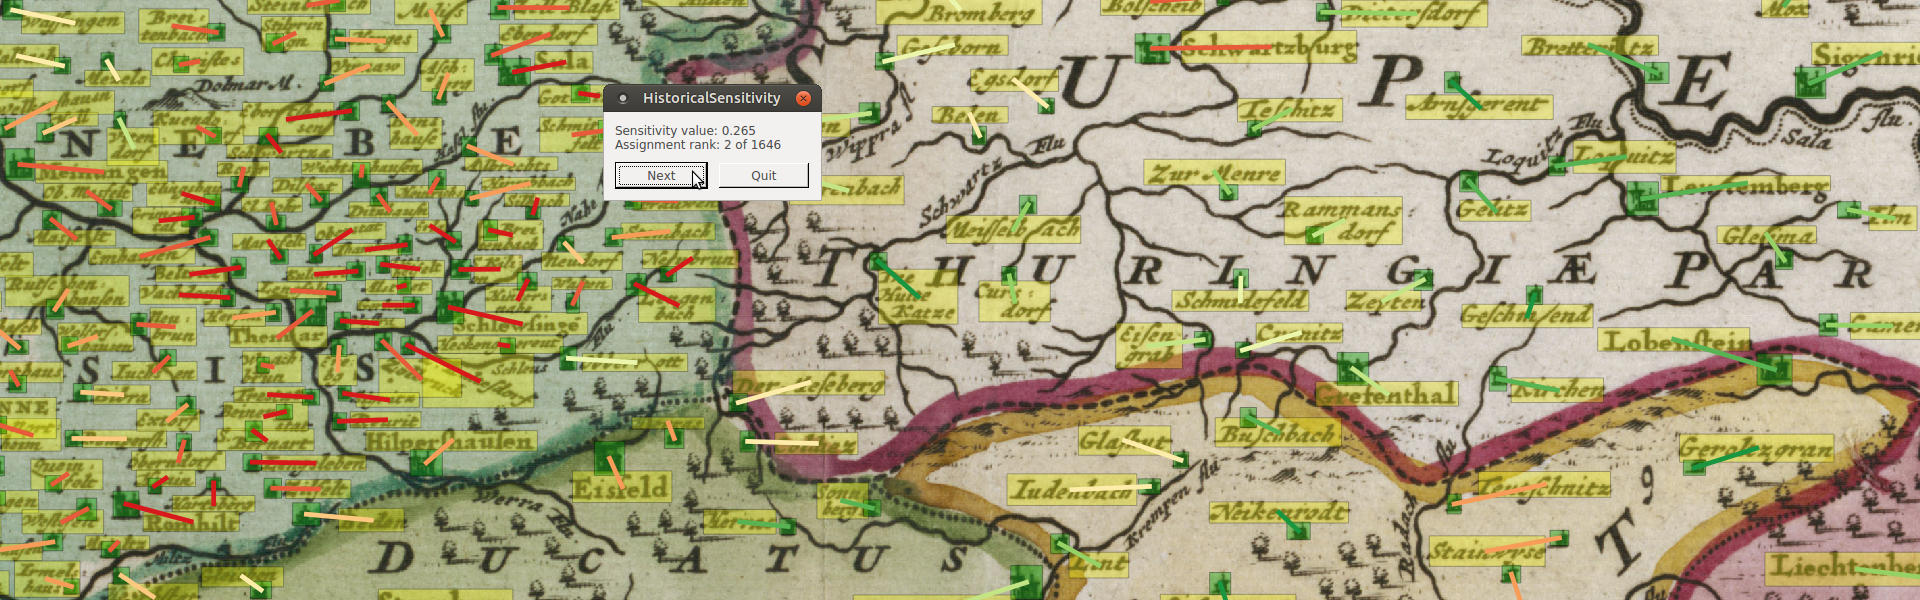
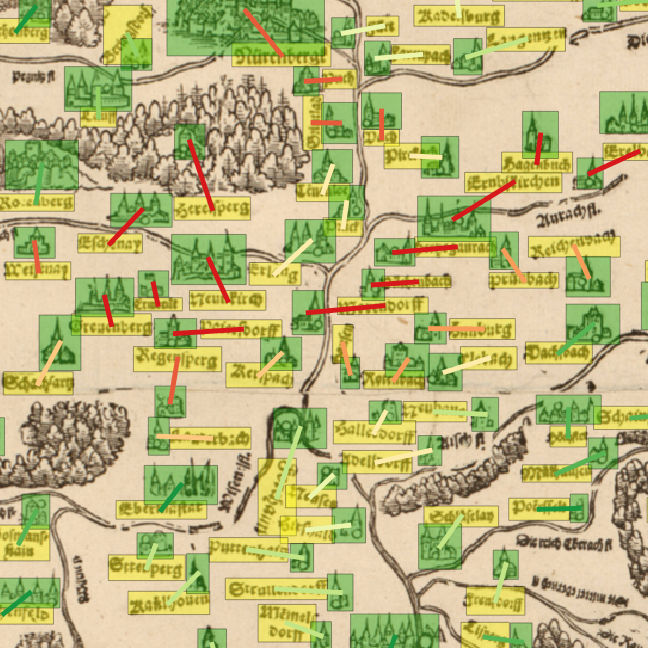
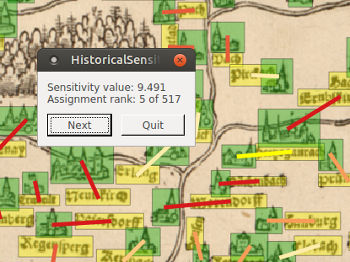
Pointing users to difficult situations.
However, algorithms won't be able to solve this problem completely without human interaction. Therefore, we ask the user for help – but only for unclear situations.